

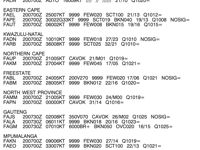
Refer to figure.
What is the correct statement about weather at FAGG?
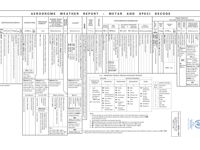
Refer to figure.
FAGG METAR: 200700Z 00000KT 1000 VCFG FEW000 BKN025 16/15 Q1022=
DECODING:
16/15 = temperature 16°C / dew point 15°C.
The dew point is the second number after the slash = 15°C.
Important Note: The temperature/dew point spread is only 1°C (16/15), which explains the fog at vicinity. When temperature and dew point are very close together, the air is near saturation and fog or mist formation is likely. This is also consistent with the 1000 m visibility reported.
Your Notes (not visible to others)
This question has appeared on the real examination, you can find the related countries below.


 Use Keyboard Shortcuts
Use your keyboard for faster navigation
