

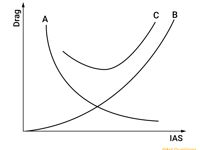
Refer to figure.
What is represented by curve A in the annex?
Refer to figure.
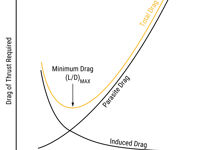
There are two main types of drag:
- Parasite drag - which increases as airspeed increases. This consists of three different types of drag:
- Form/profile drag: This is due to the shape of an object. It occurs due to the higher pressure upstream, and lower pressure downstream. It is worse for “blunt” bodies, like landing gear, and is reduced by reducing the frontal area.
- Skin friction drag: This occurs due to the friction (viscosity) of air as it flows over the surfaces. It can be reduced by either reducing the surface area, or surface roughness.
- Interference drag: This occurs due to the mixing of different airflows over a body. One stream may interfere with another, causing drag
- Induced drag - increases when the coefficient of lift is increased. This is usually the case when the angle of attack increases. In straight and level flight, induced drag increases as airspeed decreases.
- Induced drag occurs due to the 3D flow characteristics around a wing. As the higher pressure air underneath the wing flows to the upper surface of the wing, it creates wingtip vortices. These vortices change the direction of airflow over the wing, tilting the lift vector backwards. This creates induced drag.
The total drag curve shows the sum of both parasite drag and induced drag in straight and level flight. The speed at which total drag is lowest is called the minimum drag speed or VMD. This is an important speed for many reasons, particularly for single engine aeroplanes, as it is the best glide speed. At VMD, we have the best lift to drag ratio, and so will have the longest glide range.
Curve A - Induced drag
Curve B - Parasite drag
Curve C - total drag, but depicted somewhat inaccurately
Your Notes (not visible to others)
This question has appeared on the real examination, you can find the related countries below.


 Use Keyboard Shortcuts
Use your keyboard for faster navigation
