

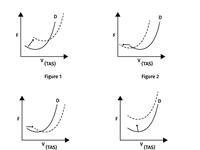
Which of the figures shows the change in the total drag graph when density altitude is increased?
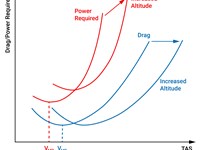
Refer to figure.
When density altitude increases, the air gets "thinner", meaning that there are less air particles per cubic metre, and therefore less air particles will hit our aircraft and flow over its wings per mile flown. This would decrease lift and drag if we were trying to maintain the same TAS. However, to counteract this effect, we fly our aircraft at a constant IAS/CAS (Indicated Airspeed/Calibrated Airspeed), which is a simple measure of dynamic pressure. This value measures the amount of air particles hitting the aircraft, and their speed.
If we fly at a constant IAS, but climb higher in the atmosphere, the lower air density means that we have to fly faster to get the same amount of dynamic pressure, meaning the same amount of air particles over the wing, etc. This is an increase in TAS (True Airspeed) for a constant IAS.
IAS directly controls our drag and our lift, as they vary proportionally to dynamic pressure, see the lift or drag equation for the mathematical proof here, it is very easy to spot.
D = (1/2 x ρ x V2)x CD x S
As dynamic pressure is 1/2 x ρ x V2, which is measured by the IAS, then drag is directly proportional to IAS, coefficient of drag, and surface area.
If the graph was for total drag against IAS, then the curve would remain in exactly the same position with increased altitude (ignoring compressibility at very high altitudes).
As the X-axis on the graphs is TAS, not IAS, then with an increase in altitude, the drag curve will look the same, but will be shifted to the right, due to the increased TAS for the same IAS at higher altitudes, but as the same forces of drag exist at each point on the curve, the curve will not move up or down. The answer is therefore figure 3, moving to the right.
Your Notes (not visible to others)
This question has appeared on the real examination, you can find the related countries below.
-
Austro Control40
-
France26
-
Spain26
-
United Kingdom20
-
Greece12
-
Italy11
-
Germany10
-
Poland10
-
Portugal9
-
Czech Republic4
-
Ireland4
-
Lithuania3
-
Hungary2
-
Romania2
-
Switzerland2
-
Bulgaria1
-
Latvia1
-
Netherlands1
-
Thailand1


 Use Keyboard Shortcuts
