

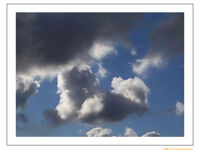
Refer to figure.
Which cloud is depicted on the attached picture?
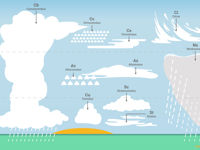
Refer to figure.
Cumulus clouds are characterized by their flat-bases and "puffy", "cotton-like" or "fluffy" appearance. These clouds are detached, dense clouds with sharp outlines. They develop vertically into rising mounds, domes, or towers, with the upper part often resembling a cauliflower. The sunlit portions of these clouds are a brilliant white, while the base is relatively dark. They vary greatly in size, ranging from small fair-weather cumulus in summer to large towering cumulus.
Your Notes (not visible to others)
This question has appeared on the real examination, you can find the related countries below.
-
Austro Control2
-
Czech Republic1
-
Romania1
-
United Kingdom1


 Use Keyboard Shortcuts
Use your keyboard for faster navigation
