

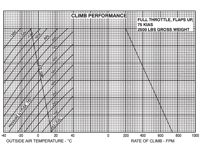
Refer to figure.
Using climb performance chart, what rate of climb is achieved based on the following data?
Pressure altitude = 4000 ft
Outside air temperature = +10°C
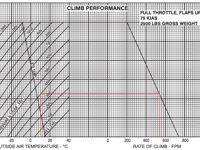
Refer to figure.
Step 1: Enter chart at OAT = +10°C on the left temperature axis
Move vertically until intersecting the 4000 ft pressure altitude line.
Step 2: intercept power line
From the point a 10° and 4000 ft, draw an horizontal line troward the right of the graphic until intercepting oblique line.
Step 3: Identify the power line
From the oblique line, draw a vertical line toward the horizontal axis.
This vertical line intercepts the axis at 540 fpm.
Your Notes (not visible to others)
This question has appeared on the real examination, you can find the related countries below.


 Use Keyboard Shortcuts
Use your keyboard for faster navigation
